The top 5 things to know about Amazon QuickSight:
-
Amazon QuickSight is an AWS business intelligence tool.
-
Amazon powers the QuickSight SPICE, a fast, parallel, in-memory calculation engine.
-
QuickSight allows users without coding knowledge to explore data and extract different insights.
-
The QuickSight platform integrates with a wide range of data sources (Amazon Redshift, Amazon Athena, local Excel files, and more).
-
QuickSight can handle multiple business domains while independently measuring business metrics.
Having the right information at your fingertips is the key to making sound business decisions. But your ability to interpret that information — and the speed at which you can access it — is equally essential. That's where Amazon QuickSight comes in.
According to the AWS website, Amazon QuickSight is "a fast, cloud-powered business intelligence service that makes it easy to deliver insights to everyone in your organization." The platform does this with stunning visuals and interactive dashboards that present real-time, machine learning (ML) insights to your company's decision-makers.
The problem is that Amazon QuickSight has a lot of cutting-edge competitors in the BI space, such as Tableau, Microsoft Power BI, and other top BI tools. Therefore, it's important to fully understand what QuickSight has to offer in comparison.
This Amazon QuickSight overview and review will outline everything you need to know about its BI capabilities, from visual presentations to advantages and disadvantages to cost, pricing, and alternatives. In addition, this article will highlight Amazon QuickSight's BI capabilities and how these capabilities can be aided through the use of a data integration platform like Integrate.io.
Integrate.io is a new ETL platform that possesses Reverse ETL, CDC, and other data integration capabilities that allow companies to better handle their valuable data and easily retrieve it from multiple sources. Read on to learn more about Amazon QuickSight in this Amazon Quicksight overview and review, or simply schedule a call with Integrate.io today!
Table of Contents
-
What Is Amazon QuickSight?
-
Visual Presentations
-
Advantages and Disadvantages
-
Cost, Pricing, and Alternatives
-
Is Amazon QuickSight Right for Your Company?
-
Let Integrate.io Help With All Your Data Integration Needs
What Is Amazon QuickSight?
Let's dive into this Amazon QuickSight overview and review. The first thing to know is that Amazon QuickSight is a business intelligence tool under the umbrella of the Amazon Web Services (AWS) platform. In addition, QuickSight features stunning visualizations, interactive dashboards, and accurate machine learning insights.
Speed is another selling point. Amazon powers the QuickSight platform with its Super-fast, Parallel, In-memory Calculation Engine, or SPICE. According to Amazon:
“SPICE is … designed specifically for fast, ad hoc data visualization. SPICE stores your data in a system architected for high availability, where it is saved until you choose to delete it. You can improve the performance of database data sets by importing the data into SPICE instead of using a direct query to the database.”
Once your BI team sets up the dashboards and visuals in QuickSight, company decision-makers can fine-tune them to display the machine learning analysis and real-time data they're looking for. Moreover, they can access their dashboards from any computer, web browser, or internet-connected iPhone or iPad device.
Visual Presentations
QuickSight is all about the visuals. Although more expensive BI solutions — like Tableau — have additional visualization options in terms of quantity, the basic visual presentations QuickSight offers are more stunning. That offers a tremendous advantage when meeting with clients and customers.
A typical visual presentation on the QuickSight platform features the following components:
-
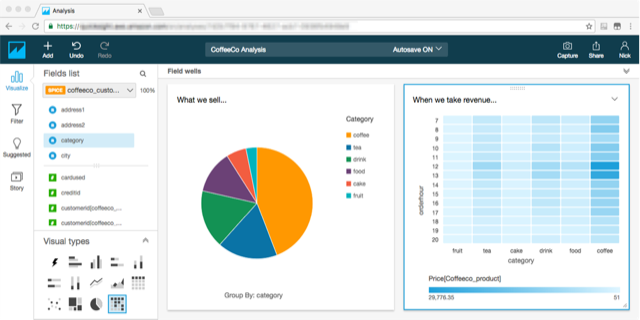
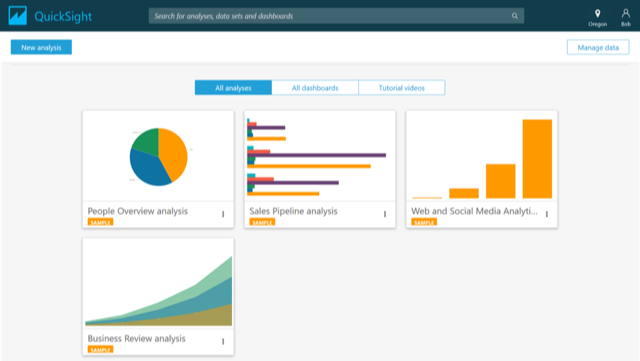
Analyses: QuickSight calls the workspace where you create and interact with visuals an “analysis.” In this analysis, you can arrange and calibrate a number of graphical data presentations, like interactive graphs and charts relating to performance metrics, sales analyses, or cost analyses. You can also include a “story” (see the definition of “stories” in the final section below).
-
Visuals: A visual is a graphical presentation of data. It could be a chart, table, graph, or diagram. Newly created visuals start in the “AutoGraph” mode. AutoGraph uses an algorithm to automatically choose visual presentations for the data you select. You can then pick your own visualizations from selections like heat maps, treemaps, combination charts, pivot tables, and more. You can also change the colors, apply filters, and reorganize their positions.
-
Insights: Insights offer valuable interpretations of the data in your “analyses.” QuickSight’s Enterprise Edition will automatically suggest appropriate machine learning insights — and data presentations — after analyzing your data.
-
Sheets: Sheets are groups of visuals that appear on a single page. While setting up an analysis, you’ll put the selected visuals into the sheet, like the front page of a newspaper. Your analysis can include more than one sheet, each with its respective visualizations working together or separately.
-
Stories: A story allows you to capture multiple visuals or “scenes” that you present on the sheet, like a slideshow. Users can scroll through the scenes in the story to see different aspects of the analysis. The scenes aren’t static — they update in real-time like all the other graphs, charts, and datasets on the dashboard.
Together, the above features allow your BI team to create beautiful, interactive data presentations to assist in diverse business areas:
-
Managers can use them to inform their leadership decisions.
-
Sales personnel can use them during client presentations.
-
Marketing teams can use them to track the results of advertising campaigns.
-
Accountants can use them to monitor key financial metrics.
Advantages and Disadvantages
After evaluating the QuickSight platform and finding out what real users think, we identified the following advantages of Amazon QuickSight:
Key Advantages of Amazon QuickSight
Quick Setup and Easy to Use
Your BI team can activate the SPICE engine, integrate data, and start using the QuickSight platform much faster than other BI platforms. According to this user: “It takes less than one hour to set up.”
Another user says: “Easy and intuitive user interface… Less learning curve.”
Highly Compatible with Different Data Sources
Integrating QuickSight with different data sources is easy. The platform integrates with data sources like Amazon Redshift, Amazon Athena, Amazon S3, Amazon Aurora, Apache Spark, Presto, SQL servers, local Excel files, and more. It also supports information from services like Salesforce and Tableau.
As this user states: “You are able to choose your data source. It can be integrated with the popular BI tools and much more.”
This user said: “I loved that it has support for other services such as Salesforce, Tableau, etc., to import data.”
Access Dashboards on Any Web Browser or iOS Device
Most users will access QuickSight dashboards and insights through a web browser. According to QuickSight, “Amazon QuickSight supports the latest versions of Mozilla Firefox, Chrome, Safari, Internet Explorer version 10 and above, and Edge.” iPhone and iPad users can also access and interact with the dashboard via their internet-connected iOS devices.
A Quicksight Dashboard
Stunning Visualizations
Compared to other solutions like Tableau, most users agree that the quality and presentation of QuickSight’s visualizations are superior. In addition, QuickSight’s “AutoGraph” feature applies a set of algorithms to learn about your data. Then it recommends suitable graphics to make sure you’re selecting the best visuals and analytics for the situation.
Get Insights Without Needing to Code
The interactive nature of QuickSight dashboards allows users without coding knowledge to explore data and extract different insights. This empowers everyone to access the vital stats they need.
Cost-Friendly Payment Options
In comparison to older or more-developed BI solutions like Tableau Server and Microsoft Power BI, Amazon Quicksight is a more cost-friendly solution at both the individual level and for enterprises as a whole.
Here’s what users say about QuickSight pricing:
“We chose them mainly because of the pay per session feature that they have. This allows us to only have to pay for what we actually use. With no upfront costs and no annual fee, these guys are hard to beat.”
“The cost is very low compared to other solutions.”
“The cost can’t be beaten. While the package lacks many of the bells and whistles that are in Tableau or Looker, it has all the basics and gets the job done for 90% of our users.”
Impressive Scalability
QuickSight can handle multiple business domains while independently measuring business metrics. Tens of thousands of users can work on the platform simultaneously with access to all sources of data at the same time. In addition, QuickSight’s cutting-edge data engine technology frees up users to explore gigantic datasets.
Excellent iOS App for Mobile Access
The app for Amazon QuickSight (for iOS and Android) delivers on-the-go access to data, so decision-makers can view stories, insights, analyses, and dashboards wherever they are.
Key Disadvantages of Amazon QuickSight
Amazon QuickSight is not without its disadvantages. After using this platform and finding out what real users think, we identified the following setbacks:
-
Limited Options for Charts and Graphs
Users complain that the options for charts and graphs — although visually stunning — are limited compared to other flagship BI solutions. This is the most frequently cited disadvantage of QuickSight. As this G2Crowd reviewer states: “Compared to Tableau or other focused solutions, Amazon QuickSight still lacks a lot of customization features. Limited data visualization types (only a few simple and popular charts)…”
One more user says: “It lacks some useful visualization capabilities found in competing tools.”
This user provides more detail:
“There is a severe lack of ability to make custom fields, group bys, and other features that other BI solutions excel at. For example, I wish I could have the functionality to really customize some level of detail expressions as well as more control over the colors and styles of the visualizations. Currently, it is not flexible enough to meet most of my customer’s needs. For example, my customers will not only want high-level looks but also want to drill down and pull out tables of data which seems like it is implemented but is not robust enough.”
In response to these criticisms, it’s important to note that Amazon is still developing QuickSight — and the platform will continue to evolve with new features over time. As of May 2022, Amazon QuickSight has achieved a 4 out of 5-star rating from 157 user reviews on G2.
-
Still New to the BI Scene
QuickSight is new to the BI scene and requires further development to reach parity with popular BI solutions like Tableau and Microsoft Power BI. That’s a fact. Nevertheless, the pay-per-session pricing makes QuickSight one of the most cost-effective BI solutions available. However, larger enterprises may choose to go with one of the more established BI solutions as they tend to have better administrative features.
Cost, Pricing, and Alternatives
Amazon QuickSight: Cost and Pricing
When it comes to BI tools, Amazon QuickSight is a cost-effective solution at both the standard and enterprise levels. In addition, Amazon QuickSight has two pricing structures at the enterprise level, which include both readers and authors.
-
Amazon QuickSight Standard Edition Pricing (Authors)
-
At the standard edition level, authors can create and publish interactive dashboards for just $9 per month with an annual subscription that requires a one-time yearly payment of $108.
-
If authors would rather choose a month-to-month plan with the opportunity to cancel at any time, they will have to pay $12 per month.
-
Both of these payment options come with 10 GB of SPICE per author.
-
Authors can pay $0.25 per GB for additional capacity if more SPICE capacity is needed.
-
Amazon QuickSight Enterprise Level Pricing (Authors and Readers)
-
Authors can create and share dashboards with other users in the account for $18 per month with an annual subscription that will require a one-time payment of $216.
-
Authors can also choose a month-to-month plan for $24 per month with the ability to cancel at any time.
-
Authors with Q can explore their data simply by asking questions, setting verified answers, and fine-tuning Q to better align with business domains for $28 per month with an annual subscription that will require a one-time payment of $336.
-
Authors with Q can also choose a month-to-month plan for $34 per month with the ability to cancel at any time.
-
Readers with the user pricing can explore interactive dashboards, receive email reports, and download data for $0.30 per session up to $5 max per month.
-
Readers with the capacity pricing can purchase reader sessions or Q sessions in bulk without having to provision individual readers.
-
Plans are based on capacity, with the lowest monthly capacity plan being 500 sessions per month for $250 per month.
-
The lowest annual capacity plan is 50,000 sessions per year for $20,000 annually.
-
More pricing options can be found on AWS.Amazon.
-
Readers with Q with the user pricing can explore topics shared with them by simply asking questions for $0.30 per session up to $10 max per month.
-
In addition, accounts enabled with Q are charged $250 per month for a Q base fee.
-
-
There are two options for authors at the enterprise level, which include Authors and Authors Q.
-
Authors
-
Authors with Q
-
Additionally, there are two options for readers at the enterprise level, which include Readers and Readers with Q. Plus, there is a user pricing plan and a capacity pricing plan.
-
Readers
-
Readers with Q
Alternatives to Amazon QuickSight
While Amazon QuickSight offers its users access to some top-tier BI tools, they face some steep competition in the business intelligence space. Let’s compare some of Amazon QuickSight’s top competitors.
-
Tableau Server
-
As of May 2022, Tableau Server has achieved a 4.2-star rating out of 5 stars on G2 from 424 users. In comparison, Amazon QuickSight has received 4 out of 5 stars from 157 users.
-
Reviewers of the two platforms noted that Tableau Server is easier to administer, but Amazon QuickSight is easier to use and set up.
-
Tableau Creator is available for $70 per month, which is billed as $840 annually. In comparison, enterprise users can get started on Amazon QuickSight for just $18 per month, which is billed as $216 annually.
Related Reading: The Best Tools for Visualizing E-Commerce Data
-
Microsoft Power BI
-
Power BI Pro provides individual users with self-service analytics for $9.99 per month.
-
Power BI Premium provides individual users with advanced self-service analytics and data management for $20 per month.
-
Power BI Premium per capacity is available for organizations starting at $4,995 per capacity per month.
-
-
As of May 2022, Microsoft Power BI has achieved a 4.4-star rating out of 5 stars on G2 from 792 reviews.
-
Reviewers noted that both Microsoft Power BI and Amazon QuickSight were easy to use and set up. However, the average reviewer preferred the administration ease offered by Microsoft Power BI.
-
Microsoft Power BI has a variety of pricing options.
Related Reading: How to Prepare Data for Microsoft Power BI
Is Amazon QuickSight Right for Your Company?
Amazon QuickSight customers praise the platform’s speed, ease of use, and sound data analytics. They laud the visual appearance of its interactive dashboards. And they appreciate saving money with its pay-per-session pricing. Moreover, you’ll be in good company if you decide to be a QuickSight customer. Their client list includes prestigious names like:
-
The National Football League (NFL)
-
Siemens
-
Rio Tinto
-
Volvo
-
AutoTrader
-
Best Western
-
MLB Advanced Media
Ultimately, QuickSight is a quality BI solution without complexity. Choosing this cost-friendly business intelligence platform from Amazon means that you will be in good hands.
Related Reading: How to Build a Business Intelligence Strategy
Let Integrate.io Help With All Your Data Integration Needs
Hopefully, this Amazon QuickSight overview and review has given you a deeper insight into what this BI solution has to offer your organization. So, are you ready to employ Amazon QuickSight as your new business intelligence solution? Here’s one thing to know: the process of integrating large volumes of data from multiple sources with a new BI solution can be time-consuming and headache-inducing.
That’s when Integrate.io can make your life easier. Integrate.io is a fast, powerful, easy-to-use ETL solution that extracts, transforms, and loads information from virtually any kind of data source into your BI solution’s data warehouse. In addition, Integrate.io is a new ETL platform that possesses Reverse ETL, CDC, and other data integration capabilities that allow companies to better handle their valuable data.


