You have been putting in the work, and your company has been growing manifold, Your client base is growing more than ever, and the projects are pouring in. So what comes next? it is now time to focus on the data that you are generating. When programming an application, DevOps engineers keep track of many things, such as bugs, fixes, and the overall application performance. This ensures that the application operates with minimum downtime and that any future errors can be predicted. In recent years, data complexity and volume have grown such that it requires similar handling and observability.
Modern organizations use data for steering decision-making. Data analysis provides them with valuable information regarding what goes on beneath the surface and where things need to be improved. However, all these analyses are pointless if the data behind them is incorrect, which is more common than you think since data is not only growing but also changing. Many business leaders are skeptical of the provided facts and figures. To create and solidify some trust, organizations are now moving towards implementing data observability frameworks.
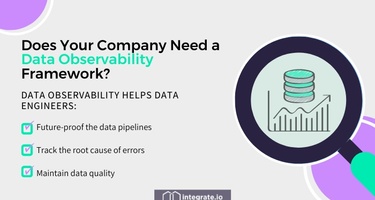
Data observability helps data engineers with maintaining data quality, tracking the root cause of errors, and future-proofing the data pipelines. Let’s talk about the benefits in more detail below.
What Questions Does Data Observability Answer?
Data observability is a DataOps procedure that takes inspiration from DevOps and helps with tracking data health issues and errors and triaging in real-time. It goes above and beyond the norm of data monitoring and provides organizations with a holistic view of data, including monitoring bad data, sudden changes in schemas, and tracking unusual activities.
Using data observability platforms, organizations understand the capabilities and robustness of their data pipelines. It helps data teams corner issues before they lead to data downtimes and loss of revenue.
How Software Observability Differs from Data Observability
Now we have talked about how DataOps takes inspiration from DevOps, but monitoring software and data governance are fundamentally different. A software product has different needs, while a data infrastructure is handled in a different way. Due to this, software and data observability follow different policies and practices.
The Three Pillars of Software Observability
Software observability is all about analyzing software health and behavior once it is deployed. This is done by keeping an eye on every action that goes on within the application and all of its relevant modules and components. Monitoring data via the following data.
Logs
Logs are generated upon every execution that happens within an application. This contains comprehensive detail about every minute action that happens within the application, including errors. These contain exact timestamps for when the action took place so that they are easy to trace.
Metrics
Metrics are a numerical representation of overall system health. These provide a holistic view of overall performance and system efficiency. Some common metrics to follow are:
-
API response times.
-
Request response times.
-
CPU/GPU usage.
-
RAM usage.
These metrics are commonly displayed on real-time dashboards, so engineers are aware of the system at all times.
Traces
Traces tag the entire life cycle of a request. It starts when a request is made and goes through all function calls, APIs triggered, and services invoked, along with the timestamps for each action. In simple terms, traces can be considered lineage tracking within the software. These are very helpful during troubleshooting when you want to reproduce the error and want to observe all the states the application goes through before crashing.
Major Components of Data Observability Framework
Data observability frameworks automate error detection and maintenance of high-quality datasets. These work upon a set of pre-defined rules and standards which allow them to detect when the information is not up to the mark and raise alerts accordingly. The standards are discussed in detail below.
Data Quality Metrics
-
Freshness: Freshness becomes vital when you realize how soon data becomes stale. It aims to keep all data sources up-to-date so that all analyses and machine-learning models depict the latest trends and information.
-
Uniqueness: Uniqueness refers to checking data for duplicate information. Duplicate entries provide erroneous aggregated results and hence invalidates the work of data analysts. More uniqueness in the data means better quality.
-
Completeness: Data should not be missing any essential information. Incomplete information means analytics are not in their best form, and machine learning models will be lacking in performance.
-
Distribution: Many times, numeric data is predictable in its distribution. This means that we already have an idea of what the range, mean, and skewness of the data should be. As an example, when dealing with medical records, unusual values such as a weight of several hundred kilos or a blood pressure value in the thousands is a clear indication that the data is incorrect. Unusual distribution leads to data quality issues.
Metadata & Lineage
The data quality metrics discussed in the above sections are calculated via its metadata. Metadata is the data about the data. It contains the numerical values which represent the state of data, such as:
-
Size on the disk.
-
The number of rows and columns in each table
-
Time of data creation
-
Time since the last alteration.
It also contains additional information, such as who is authorized to access the data and what applications it is attached to. All this information is very helpful when observing data systems. It helps monitor many different aspects of the ecosystem and adds to the overall robustness of the data observability framework.
When data downtime occurs, the first step is to locate the source of the error. This can be difficult due to complex data pipelines, and tracking data lineage becomes vital. Data lineage is the DataOps counterpart of traces in DevOps. It tracks and tags data throughout its life cycle, and data observability tools utilize these tags along with the tracked metrics to accurately identify the error source.
Logs
logs contain comprehensive information regarding the state of the data. These are generated whenever an event occurs, such as a table creation or deletion. Logs are powerful because they track the workflow sequentially, and with every event recorded, a timestamp is recorded. This makes it easier to track when a certain action occurred.
Alerting
Metric tracking is useful, but users are not always vigilant enough to continuously check them for errors and irregularities. A data observability solution is incomplete without the ability to notify users when it detects unusual activity. Some critical alerts are triggered by the following events:
-
Schema changes: A schema change could break the entire pipeline by disrupting the automated workflows. Schema changes should be immediately notified so the existing workflows can be amended accordingly.
-
Status Failures: Alerts are triggered when a scheduled job fails execution. Users can then check the logs and traces to understand when and where the problem occurred.
-
Volume Anomalies: If tables that expect small amounts of data suddenly receive gigabytes worth of information, it means that there is some error in the ETL pipeline. Data observability tools include anomaly detection mechanisms that raise alerts promptly.
-
Duration Problems: Jobs running for longer periods of time than usual could indicate either an inefficient query or some error in it. An alert for this can be useful so the problem can be timely fixed.
Best Practices for Implementing Data Observability
We have already established why data observability is important however it is also vital to discuss how to implement it. It is common for firms to dive into implementation without proper research, which leads to additional faults. There are a few things to keep in mind while implementing a data observability framework.
Don’t Track Everything
Your system might contain millions of records and hundreds of data touchpoints. The ETL pipeline will be complex, so keeping traces and logs of every single action would make the log outputs hard or even impossible to read. Imagine you have an error traceback to locate, you open up the logs, and there are millions of lines to go through. That would be a menace.
Identify Critical Areas
Identify all the critical aspects of your data ecosystem so that you know what traces to maintain and what critical logs to turn on. It is most useful to understand the hierarchy of importance within the system. The most critical places, e.g., where data undergoes important transformation or where a large number of rows are affected, should have every aspect tracked. As for the rest, you need to decide the importance yourself.
Don’t Have Alerts For Everything
Only put alerts on critical events others wise, it will be very disturbing if you receive alarms and notifications for every minute event. This can also disregard the seriousness of any future alerts
How Does Data Observability Compare With Other Data Frameworks & Processes?
There are many frameworks that are used to maintain the state of data. All of these focus on different aspects of the database, such as health, quality, and integrity. Let’s see how some of these compare with data observability.
Data Observability vs. Data Governance
Data governance sets standards and policies to govern the state of data. The policies help with the validation of data and ensure that everything is going as expected. Data observability is not too far off from governance as the former actually implements the rules laid out by the latter. Not all governance policies can be monitored, but with data observability tools, a lot more is possible than what was before. Modern observability frameworks allow users to define rules so that no separate governance platform is required,
Data Observability vs. Data Monitoring
Data monitoring refers to raising alerts for data engineers when a certain monitored metric goes out of bounds. We have seen how data observability tracks metrics and raises alerts as well, but with additional functionality. Monitoring requires thresholds to be set manually, which is difficult. Data observability provides a holistic view of the entire database, so engineers what to expect at every part of the pipeline. Combining multiple features, data observability makes monitoring much easier and more accurate.
Data Observability vs. Data Integrity
Integrity encompasses all features that help users establish trust in the data. These include correctness, completeness, and consistency. Integrity is vital for data analysts and data science teams that use this information to develop important visualization and projects. Data observability lays great emphasis on quality metrics such as completeness and accuracy to maintain the integrity of the data.
Data Observability vs. Data Reliability
Data reliability is the older brother of integrity. While integrity focuses on what the data tables contain, reliability covers the internal and external information, such as schemas and maintaining Service Level Agreements (SLAs). Data observability does all this, which is why the two terms are often used interchangeably.
The bottom line from these comparisons is that data observability offers the combined functionality of every data framework previously used. It might just be the most complete solution for maintaining data assets such as data tables with quality and standards.
Building a Data Warehouse? Look No Further
The best time to implement data observability is right when you’re planning to construct your infrastructures, such as a data warehouse or a data lake. This way, you can optimize your data observability metrics, logs, and traces. While blueprinting the infrastructure, it becomes easier to identify critical aspects and create a list of important events to log.
With modern tools like integrate.io, data warehousing works like a breeze. Integrate offers seamless integrations with several data vendors and platforms, such as AWS redshift and Oracle. Furthermore, Integrate also provides warehouse insights which give you an edge in implementing data observability solutions. Integrate provides all the necessary components to build and assist your data stack.
If you’re planning on shifting to a warehouse infrastructure, get a free consultation from one of our experts. Our data management solutions will surely be a valuable addition to your infrastructure.


