- More Data, More Storage
- What Is Data Observability?
- Data Observability Principles
- Why Is Data Observability Important?
- Integrate.io vs. Monte Carlo: Side-by-Side Comparison
- What Is Integrate.io?
- What Is Monte Carlo Data?
- Data Quality Monitoring and Data Observability: Integrate.io vs. Monte Carlo
- Data Observability FAQs
In today's fast-paced world, businesses generate massive amounts of data every second. With the sheer volume of data being produced, it's becoming increasingly difficult to monitor, detect and troubleshoot errors in real time.
That's where data observability solutions come into play. Two of the most popular tools in this space are Integrate.io and Monte Carlo.
Five things to know about Integrate.io and Monte Carlo:
- Integrate.io is a cloud-based tool, whereas Monte Carlo is web-based.
- Integrate.io is an ETL platform that offers data monitoring and data observability functionality, whereas Monte Carlo is the first-ever solution to focus strictly on data observability.
- Both Integrate.io and Monte Carlo can collect, analyze, and observe data from individual systems and from the organization's entire collection of IT systems.
- Integrate.io offers 150+ prebuilt connectors, whereas Monte Carlo offers 31 prebuilt connectors.
- Integrate.io is a standalone solution, but Monte Carlo relies on Amazon Web Services (AWS) for delivery.
If you're considering a data observability solution for your business you came to the right place. In this article, we'll compare the features and benefits of Integrate.io and Monte Carlo, so you can make an informed decision on which solution is best suited for your data observability needs.
What Is Data Observability?
Data observability refers to your business's ability to view, analyze, and completely comprehend the data produced in and ingested by your systems and that data's health. Data observability applies DevOps best practices to data pipelines, ensuring fewer data incidents and less data downtime experienced due to poor, broken, or otherwise unhealthy data flowing through your machines.
Common data observability tools offer automated:
- Data monitoring
- Root cause analysis
- Lineage insights
- Health reports
- Notifications
These tools run continuously in the background, helping data teams find, fix, and avert anomalous data quality issues.
Healthy data means:
- Healthy data pipelines
- Enhanced data team productivity
- Improved data management
And the best result of all — more satisfied customers and clients.
Data Observability Principles
But none of this is possible without an understanding of the five core principles of data observability, which allow you to check your data systems for these metrics:
- Age of data. Observability looks at the age of your datasets and tables and at your updating cadence.
- Data quality. Your pipelines may be flowing just fine, but if the data that's moving through the system is junk and riddled with "data debris," the flow rate doesn't matter. A data observability tool examines the number of null and unique data points, as well as their range of acceptability. This examination ensures, even if the data is good data, that it's the intended data. In other words, performing a data quality check lets you know if you can trust your data tables to return the expected information when prompted.
- Inclusivity. In data observability, inclusivity refers to your data tables — their health and their entirety. For instance, if you know you have 5 million rows, and then suddenly you have 15 million rows, that's a problem you should identify immediately.
- Organization. Also known as schema, any changes to how your data organizes itself can indicate broken or missing data. Keeping a log of each change, when it was made, and who made it is crucial knowledge that helps you interpret the data ecosystem's health.
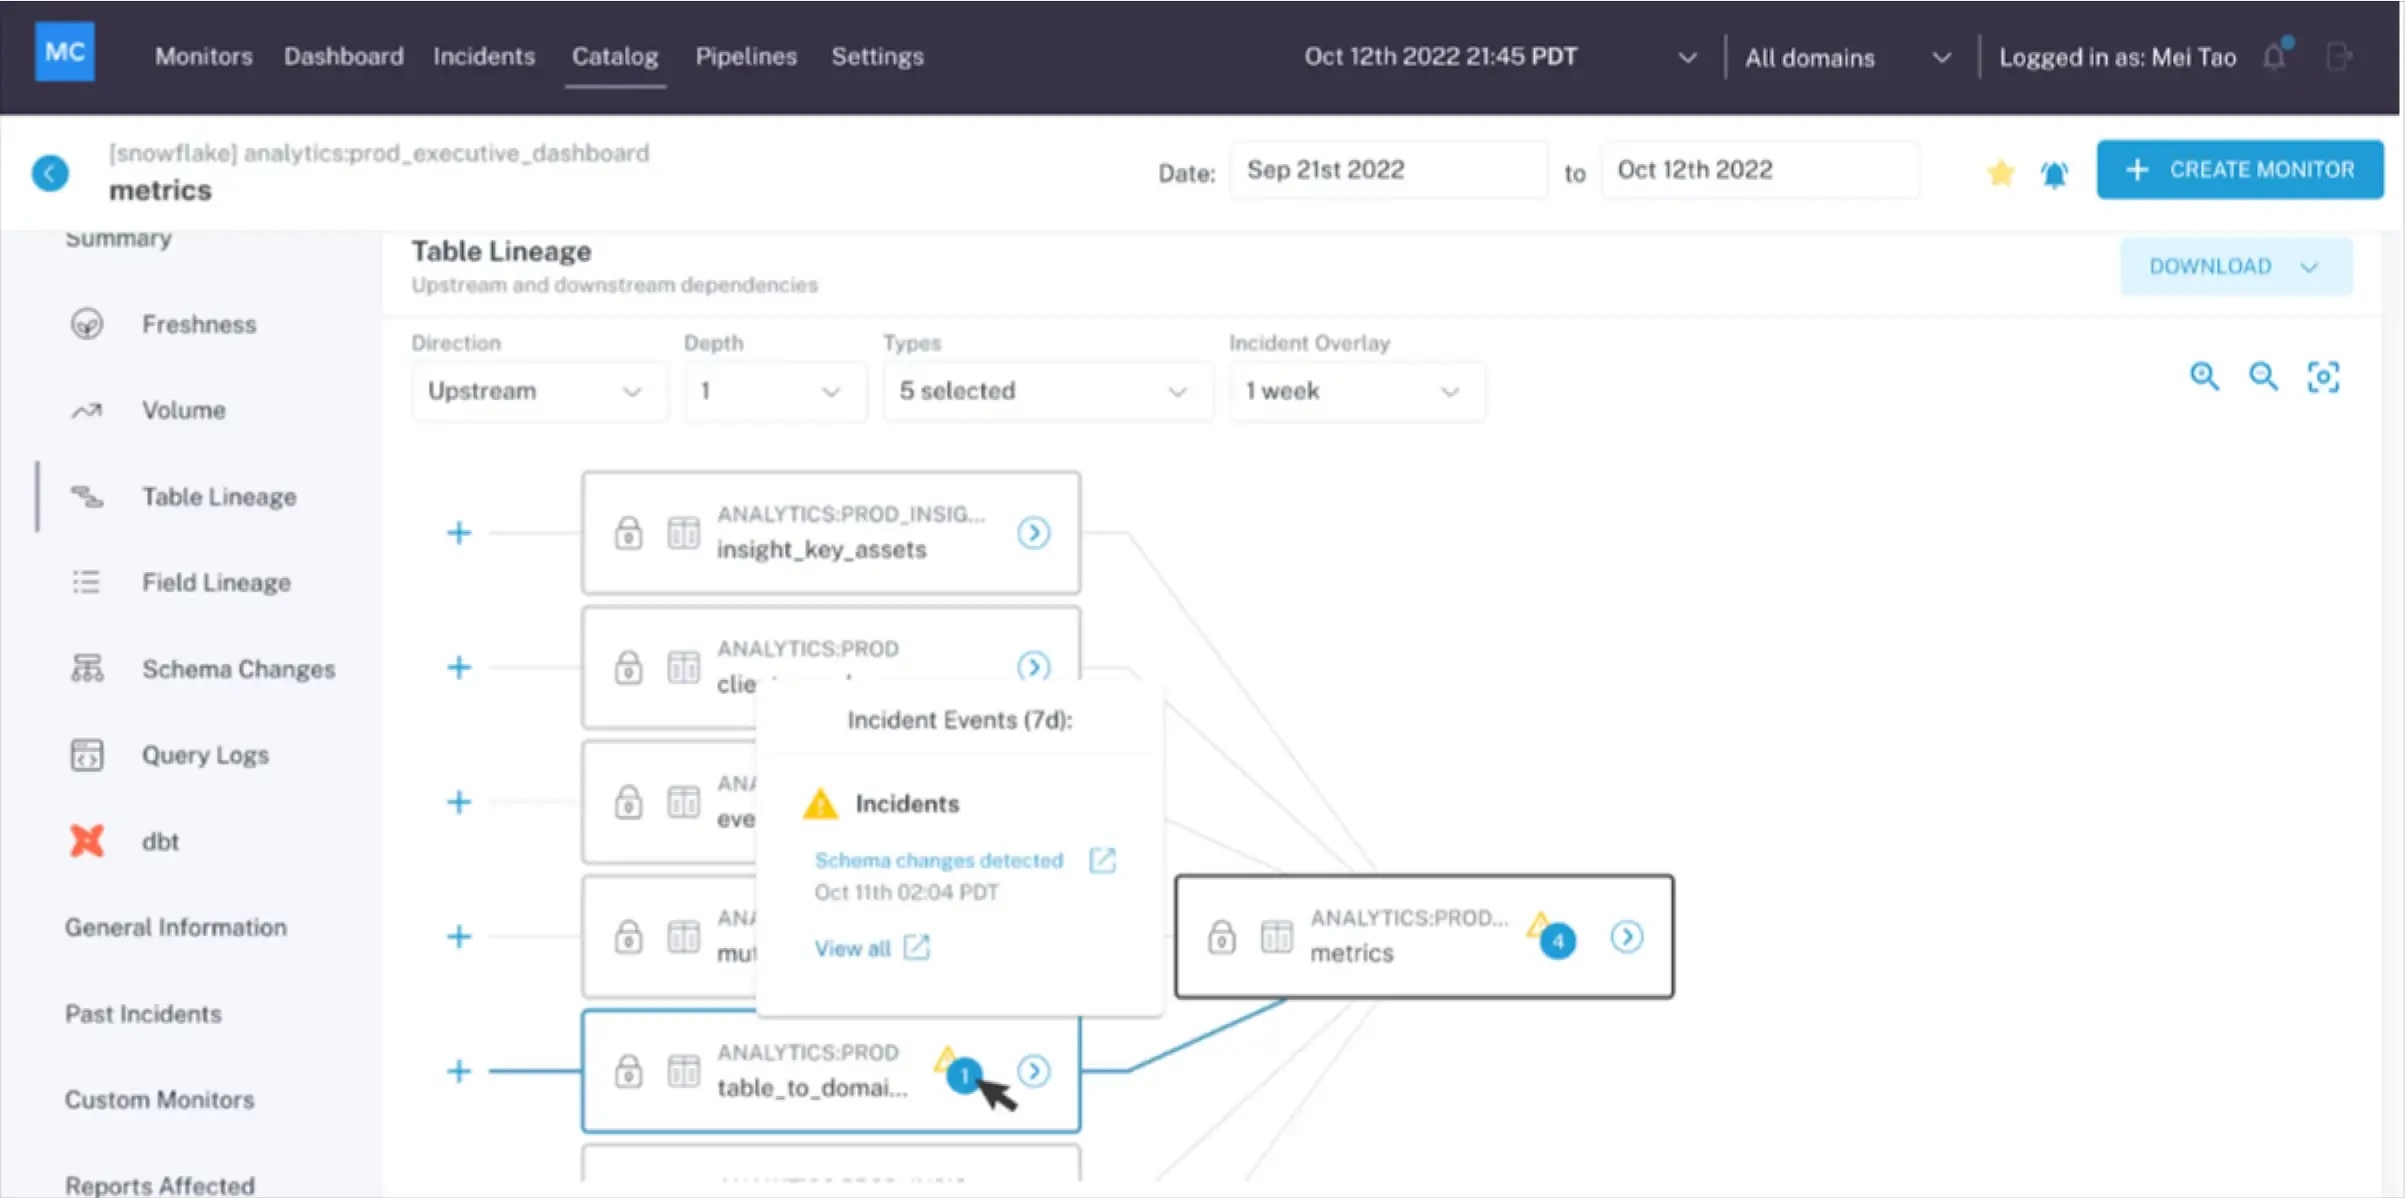
- Lineage. Think of lineage like family ties — lineage is the connection between all of your data. So, when there's a data breakdown, reviewing its lineage reveals dependencies and pinpoints exactly where the breakdown occurred upstream and what the effects of the data ingestion are downstream. This functionality also tells you:
-
-
Which team generated the data
-
Who has (and has had) access
-
The metadata for the affected data's tables
-
These five principles offer a sole source of truth highlighting your data's quality and overall reliability.
Why Is Data Observability Important?
The importance of data observability lies in the level of certainty it offers decision-making teams. Any downtime wastes resources for data engineers and development teams and lowers their confidence.
It's hard to place a value on data observability importance because it's nearly priceless. But to say it's priceless is rather subjective, so you must prove it with tangible benefits.
What Benefits Does Data Observability Offer?
Having a clear, 360-degree line of sight into your organization's data health improves:
- Quality. Like data monitoring, data observability bolsters your business data integrity by identifying and resolving issues with data quality before those issues create substantial problems.
- Consistency. Monitoring the orchestration of your data flow helps ensure your entire pipeline remains consistent.
- Accuracy. Every organization uses data in its most appropriate way, analyzing and reporting on what matters most to each department and the organization as a whole. Data observability enhances data accuracy, resulting in greater accuracy of analyses and reports, and therefore leading to more informed decision-making.
- Efficiency. Better data quality and reliability enhance your business's efficiency, resulting in greater uptime and better performance across departments.
- Trust. Clear visibility into your organization's data leads to an increased understanding of that data, which boosts your ability to trust the data's information.
Ultimately, when dashboards offer clear visibility into your business and you can trust the data you see, there's less time wasted on gauging data sources and their validity and more time dedicated to making better business decisions.
Integrate.io vs. Monte Carlo: Side-by-Side Comparison
|
Integrate.io |
Monte Carlo Data |
|
|
FEATURES & BENEFITS |
|
|
What Is Integrate.io?
Integrate.io is an ETL and reverse ETL solution. This platform provides an easy, user-friendly business solution that brings an organization's disparate data into one dashboard. Every system, application, and business intelligence (BI) tool is integrated, automating and improving the flow of data and giving management and the C-suite greater visibility with real-time insights.
Integrate.io comes with 158 pre-built connectors for databases, cloud storage, cloud services, advertising, logging, analytics, and business intelligence (BI) needs. Data governance compliance measures for frameworks such as GDPR, HIPAA, and more are built in, saving you from compliance errors and fines.
This robust integration platform helps you instantly connect to today's most popular data sources — without knowing how to write a single line of code. Integrate.io's no-code ecosystem has simple drag-and-drop functionality, which means even teams with no engineers or little to no coding experience can integrate complex data from disparate sources with just a few clicks. And if you're running programs you don't see a connector for? Suggest it — we'll build it for you!
What Is Monte Carlo Data?
Monte Carlo is an end-to-end, web-based data observability solution that monitors today's data stack and sends alerts when there's a problem in an organization's data warehouse or data lake. Like Integrate.io, Monte Carlo Data also offers ETL and BI tools. This platform utilizes machine learning (ML) to train itself on your data through inference. Monte Carlo's automatic root cause analysis proactively identifies, analyzes, and assesses data for problematic issues in real time and notifies the appropriate team, leading to coordinated collaboration and faster problem resolution.
Data Quality Monitoring and Data Observability: Integrate.io vs. Monte Carlo
Integrate.io and Monte Carlo both offer data observability and data quality monitoring features.
Data Observability and Monitoring: Integrate.io
Price: Integrate.io pricing is tailored exactly to each client's needs and requirements with a usage-based component couple with features and functionality. Clients choose which level of platform usage they will require and then which features and functionality to create a custom plan to fit their use case.
Type of tool: ETL and ELT platform
Software type: Cloud-based
Customer rating: 8.2/10 on TrustRadius
- Advantages noted by reviewers include ETL functionality, data aggregation and scheduling capabilities, and breadth of prebuilt connectors.
- Disadvantages include the lack of a mobile app for tracking on the go and that ease of use could be improved.
Key features:
- Low- to no-code ETL and reverse ETL solution
- Conforms with all data governance frameworks
- Real-time analytics
- 200+ prebuilt connectors
Integrate.io Breakdown
Integrate.io offers multiple data management, functionality, solution provisioning, and development features, including:
- Reporting
- Auditing
- Real-time analytics
- Solution integration
- Infrastructure compatibility
- Data quality monitoring
- Data mapping
- Data extraction
- Data transformation
- Data loading
- Automation
- Scalability
Plus, you never pay for anything you don't use, and the platform offers 150+ pre-built connectors.
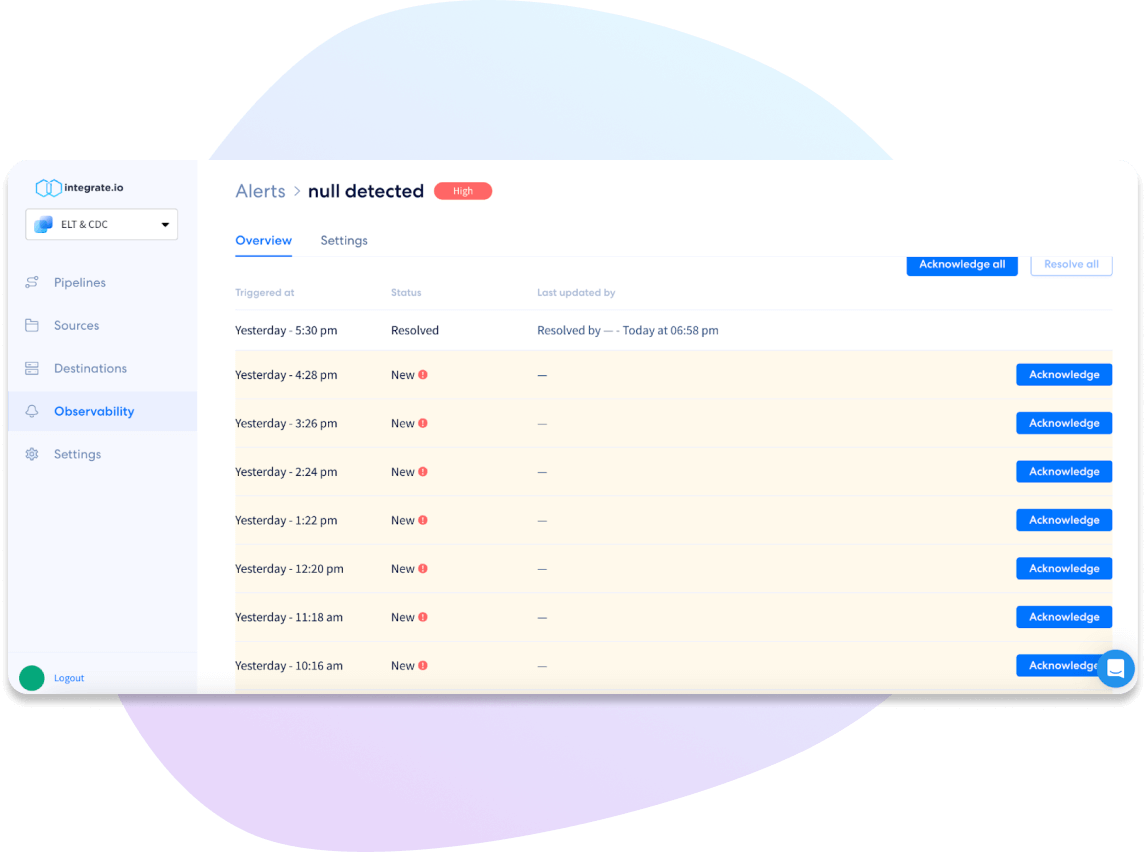
Integrate.io's detailed real-time data quality monitoring keeps tabs on:
- Null counts in data columns
- Row counts in data tables
- Cardinal counts within columns
- Minimum and maximum column values
- Column medians (doesn't work with MySQL sources)
- Column skew statistics
- Column variance stats
- Column means
- Data freshness in hours
Data Observability and Monitoring: Monte Carlo
Price: Monte Carlo Data doesn't publish pricing.
Type of tool: Data observability platform
Software type: Web-based
Customer rating: 4.7/5 on G2
- Advantages noted by users include faster error resolution and clearer visibility into data health.
- Disadvantages include the lack of a prebuilt domain category for separating data streams by default.
Key features:
- Real-time alerts and monitoring
- Data visualization
- Data validation
- 31 prebuilt connectors
Monte Carlo Breakdown
Monte Carlo also offers data functionality and management features, such as:
- Logging
- Reporting
- Data visualization
- Real-time analytics
- Automation
- End-to-end visibility
- Anomaly identification
- Real-time alerts
- Data lineage
Monte Carlo offers 31 integrations with common data warehousing and business intelligence tools.
Integrate.io Simplifies Data Observability
Integrate.io can simplify your data observability journey and:
- Give you total insight into your data
- Help you understand how your organization's data changes and evolves over time
- Detect anomalies with real-time analytics and root-cause analysis
- Improve your organization's compliance with GDPR, HIPAA, and other governance frameworks
And we do it all in a low- to no-code environment, helping solve complex data issues with simple data integration. Try out Integrate.io with a free 14-day trial, then schedule your ETL trial setup meeting to get the most from your trial from day one.
Data Observability FAQs
What is a data observability tool?
A data observability tool is a web- or cloud-based technology that uses data from machine learning (ML) to automate data lineage, anomalies, and other incident alerts to facilitate fast resolutions and help businesses fully see and understand how healthy their organizational data is.
What are the effects of data observability? Why do businesses need it?
Using a data observability tool helps businesses identify and fix issues with data quality before upstream errors cause downstream problems. Businesses rely on data, so discovering the source of inconsistencies and mistakes in the data ecosystem helps decision-makers act quickly to rectify issues.
What is the difference between data observability and data monitoring?
Observability and monitoring are different based on predetermination. Data observability tools collect all data from all the IT systems within an organization, whereas data monitoring aggregates and analyzes specific data from predetermined individual IT systems.

